Predict Secondary Structure
This step requires proper setup of the package biers. Please follow the installation guides there. Note that this step only requires the RNAstructure and Biers part.
We use the RNAstructure package to perform data-driven secondary structure predictions. The 1D and/or 2D data are transformed into pseudo-free energies that provide information to guide folding, on top of the built-in Nearest Neighbor thermodynamic parameters.
To estimate the confidence of the predicted result, we use nonparametric bootstrapping. In brief, this procedure resamples the data with replacement to create mock datasets, and use these to run prediction again, and summarize the result of all mock runs. This resampling technique is relevant as experimental measurements may miss certain data points (imperfect dataset). It tests whether the prediction result is robust to (slight) data variations, e.g. if one nucleotide’s reactivity dominates the outcome. For more information, see these papers:
Tian, S., Cordero, P., Kladwang, W., and Das, R. (2014)
High-throughput mutate-map-rescue evaluates SHAPE-directed RNA structure and uncovers excited states
RNA 20 (11): 1815 - 1826.
Kladwang, W., VanLang, C.C., Cordero P., and Das, R. (2011)
A two-dimensional mutate-and-map strategy for non-coding RNA structure
Nature Chemistry 3: 954 - 962.
To run RNAstructure with bootstrapping, we use this command:
[structure_pred, bpp_pred] = rna_structure(sequence, d_1D, offset, seqpos, d_2D, 100, 0);
The arguments are described in help rna_structure. Actual example commands are given below.
You can feed it pseudo-free energy bonus of 1D data, or 2D data, or both. Make sure the dimensions of
sequencematch withseqpos, andd_1Dord_2D.
You can change the number of bootstrap samplings (100 in the code above).
You can choose which RNAstructure program to run,
Fold(0 in the code above, see here) orShapeKnot(change to 1, see here). The latter allows prediction of pseudoknot (1 only in eachsequence), but it’s significantly slower.
Once finished, the rna_structure() function returns the following variables:
| Variable | Type | Description |
|---|---|---|
structure |
1xS str | The predicted secondary strcture in doc-bracket notation. |
bpp |
SxS double | The base-pairing probability matrix. The percentage of each base-pair is calculated across all bootstrapping runs. |
SHAPE_out |
1xS double | 1D reactivity filtered. |
We will demonstrate how to visualize the results in next step.
How to run RNAstructure with SHAPE 1D and 2D data
The original use of these scripts was to run RNAstructure on data collected from SHAPE experiments and mutate-and-map experiments using capillary electrophoresis readouts quantified by HiTRACE. If that’s your use case, follow this section. If you’re interested in M2-seq data, you can also check out the next section.
For the following, you can load up pre-existing example data available in the HiTRACE package: load '/path/to/HiTRACE/Examples/example_pfl_1D.mat' and load ‘/path/to/HiTRACE/Examples/example_pfl_2D.mat’.
Here is an example script for running RNAstructure with different inputs:
% Prediction with no data, only thermodynamic parameters
% No need to bootstrap since there is no data to sample
[structure_NA, bpp_NA] = rna_structure(sequence, [], offset, seqpos_out, [], 0);

% Run Fold with 100x bootstrap on 1D SHAPE data
[structure_1D_Fold_SHAPE_minus, bpp_1D_Fold_SHAPE_minus] = rna_structure(sequence, d_SHAPE_minus, offset, seqpos_out, [], 100, 0);
[structure_1D_Fold_SHAPE_plus, bpp_1D_Fold_SHAPE_plus] = rna_structure(sequence, d_SHAPE_plus, offset, seqpos_out, [], 100, 0);

% Run ShapeKnot with 100x bootstrap on 1D SHAPE data
[structure_1D_Spkt_SHAPE_minus, bpp_1D_Spkt_SHAPE_minus] = rna_structure(sequence, d_SHAPE_minus, offset, seqpos_out, [], 100, 1);
[structure_1D_Spkt_SHAPE_plus, bpp_1D_Spkt_SHAPE_plus] = rna_structure(sequence, d_SHAPE_plus, offset, seqpos_out, [], 100, 1);

% Run Fold with 100x bootstrap on 2D SHAPE data
[structure_2D_Fold_SHAPE, bpp_2D_Fold_SHAPE] = rna_structure(sequence, [], offset, seqpos, Z, 100, 0);
% Run ShapeKnot with 100x bootstrap on 2D SHAPE data
[structure_2D_Spkt_SHAPE, bpp_2D_Spkt_SHAPE] = rna_structure(sequence, [], offset, seqpos, Z, 100, 1);
Make sure you have an idea of the time the
ShapeKnotrun takes. Always runShapeKnotwith 0 bootstrap, and time it withticandtoc. Your MATLAB do not respond to other operations while runningrna_structure()(or any command).
If 100x bootstrap for
ShapeKnottakes too long (hours), you may consider run it overnight, or move to a cluster.
Save the results of different runs to different variables to prevent overwriting each other.
You can also run with 1D and 2D data together:
% Run ShapeKnot with 100x bootstrap on both 1D and 2D SHAPE data
[structure_1D2D_Fold_SHAPE_plus, bpp_1D2D_Fold_SHAPE_plus] = rna_structure(sequence, d_SHAPE_plus, offset, seqpos_out, Z, 100, 0);
[structure_1D2D_Spkt_SHAPE_plus, bpp_1D2D_Spkt_SHAPE_plus] = rna_structure(sequence, d_SHAPE_plus, offset, seqpos_out, Z, 100, 1);
Additionally, if the Z-score looks noisy, filtering it would be better:
Z_cutoff_mean = Z;
for i = 1:size(Z_cutoff_mean, 1);
    Z_cutoff_mean(i, Z_cutoff_mean(i, :) >= mean(Z_cutoff_mean(i, :))) = 0;
end;

Z_cutoff_1std = Z;
for i = 1:size(Z_cutoff_1std, 1);
    Z_cutoff_1std(i, Z_cutoff_1std(i, :) >= -std(Z_cutoff_1std(i, :)) + mean(Z_cutoff_1std(i, :))) = 0;
end;
The above code filters the Z-score by the mean of each column (seqpos, not mutpos), or by 1 standard deviation from the mean. You can run rna_structure() with the filtered Z-score and compare the results.
How to model structure with M2-seq data
Structure modeling with M2-seq data can happen via two routes:
- M2-net, a neural-net-inspired analysis that reproduces visual detection of helix signals.
- RNAstructure analysis, which fills in additional helices based on energy minimization, and is basically the same as for capillary electrophoresis data.
Here’s an example:
Example data
First get the data set. Let’s use data based on background mutations incorporated into the P4-P6 RNA during its DNA synthesis (by PCR assembly) and RNA synthesis (by T7 polymerase) and DMS mapping, TRP4P6_DMS_0005.rdat. A no-DMS data set is also available TRP4P6_DMS_0006.rdat
Read these into MATLAB:
r_m2seq_DMS   = read_rdat_file( 'TRP4P6_DMS_0005.rdat' );
r_m2seq_nomod = read_rdat_file( 'TRP4P6_DMS_0006.rdat' );
M2-net analysis from M2-seq data
You can run M2-net analysis and display the M2-seq data with a single wrapper script:
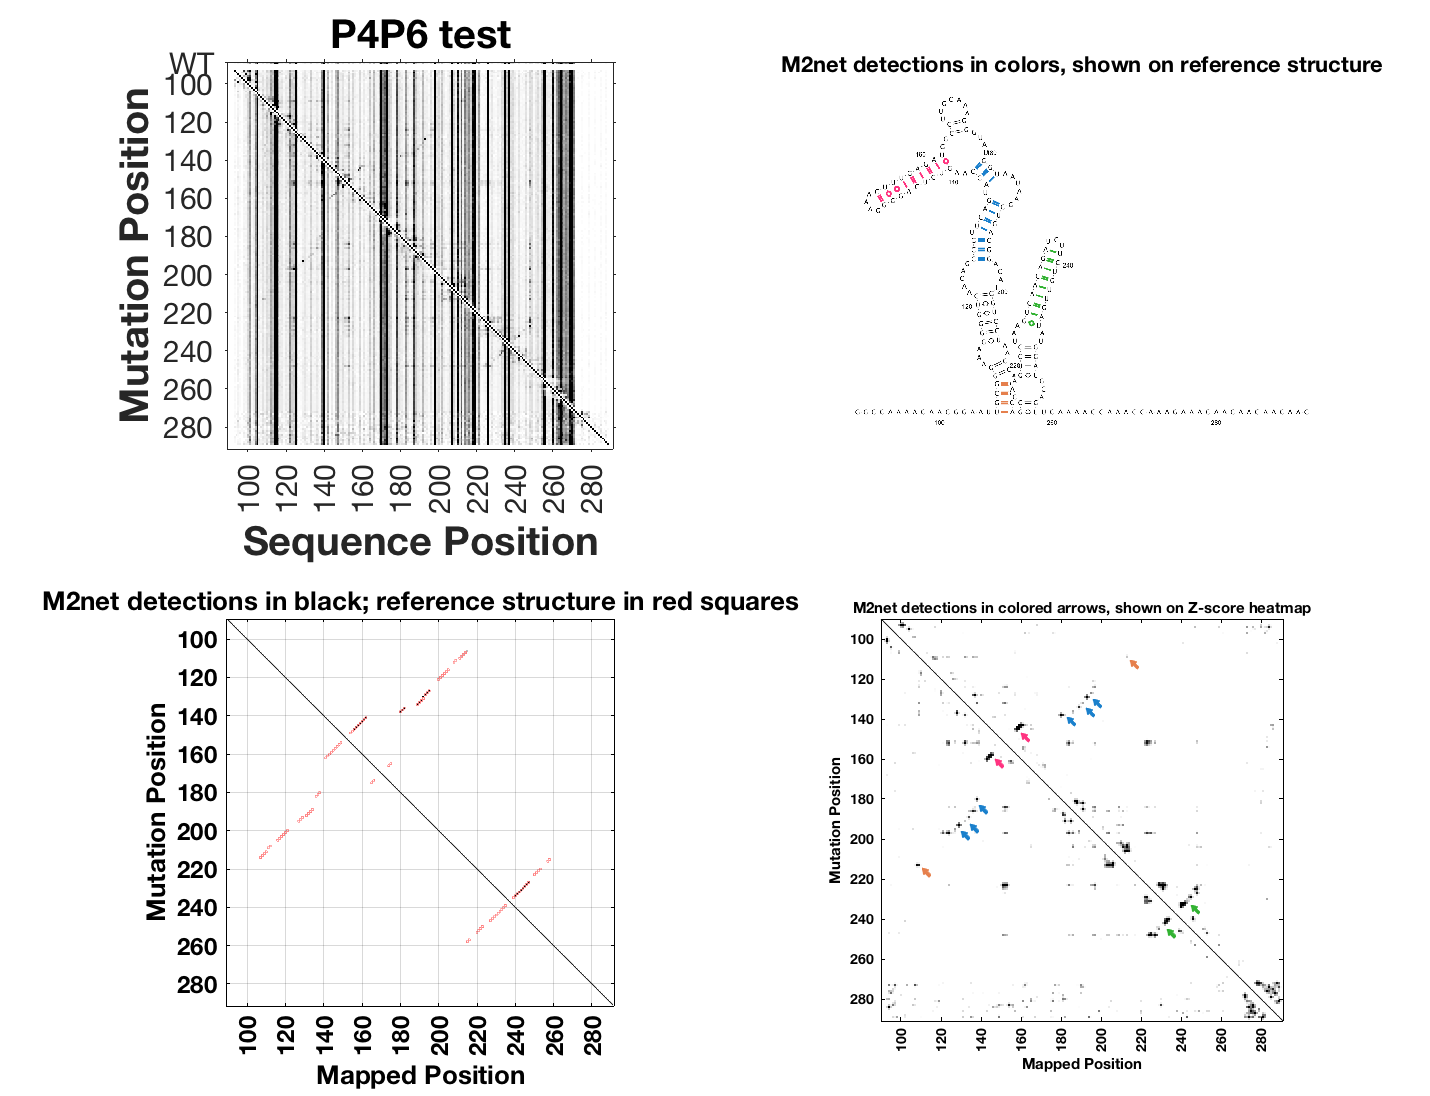
m2seq_summary( {r_m2seq_DMS r_m2seq_nomod}, 'P4P6 test' );
Note that you’ll need VARNA set up properly in Biers, as described in the installation instructions.
Here’s what the output looks like:
The top-left shows the DMS M2-seq data without any annotation. The bottom-left shows M2-net detections in black (red marks base pairs for reference structure supplied with the RDAT). The right-hand panels show M2-net detections in colors – here 6 helices are found – on the reference structure and also on the Z-scores.
RNAstructure analysis from M2-seq data
Prepare 1D and 2D Z-score files
d_DMS = SHAPE_normalize( get_DMS_profile( {r_m2seq_DMS, r_m2seq_nomod } ) );
Z = output_Zscore_from_rdat( [], r_m2seq_DMS, r_m2seq_nomod, [], 1, 1 );
Run RNAstructure with these data:
[structure_m2seq,bpp] = rna_structure( r_m2seq_DMS.sequence, [], r_m2seq_DMS.offset, r_m2seq_DMS.seqpos, Z, 100, 0, d_DMS );
Above is a fast run without pseudoknot modeling.
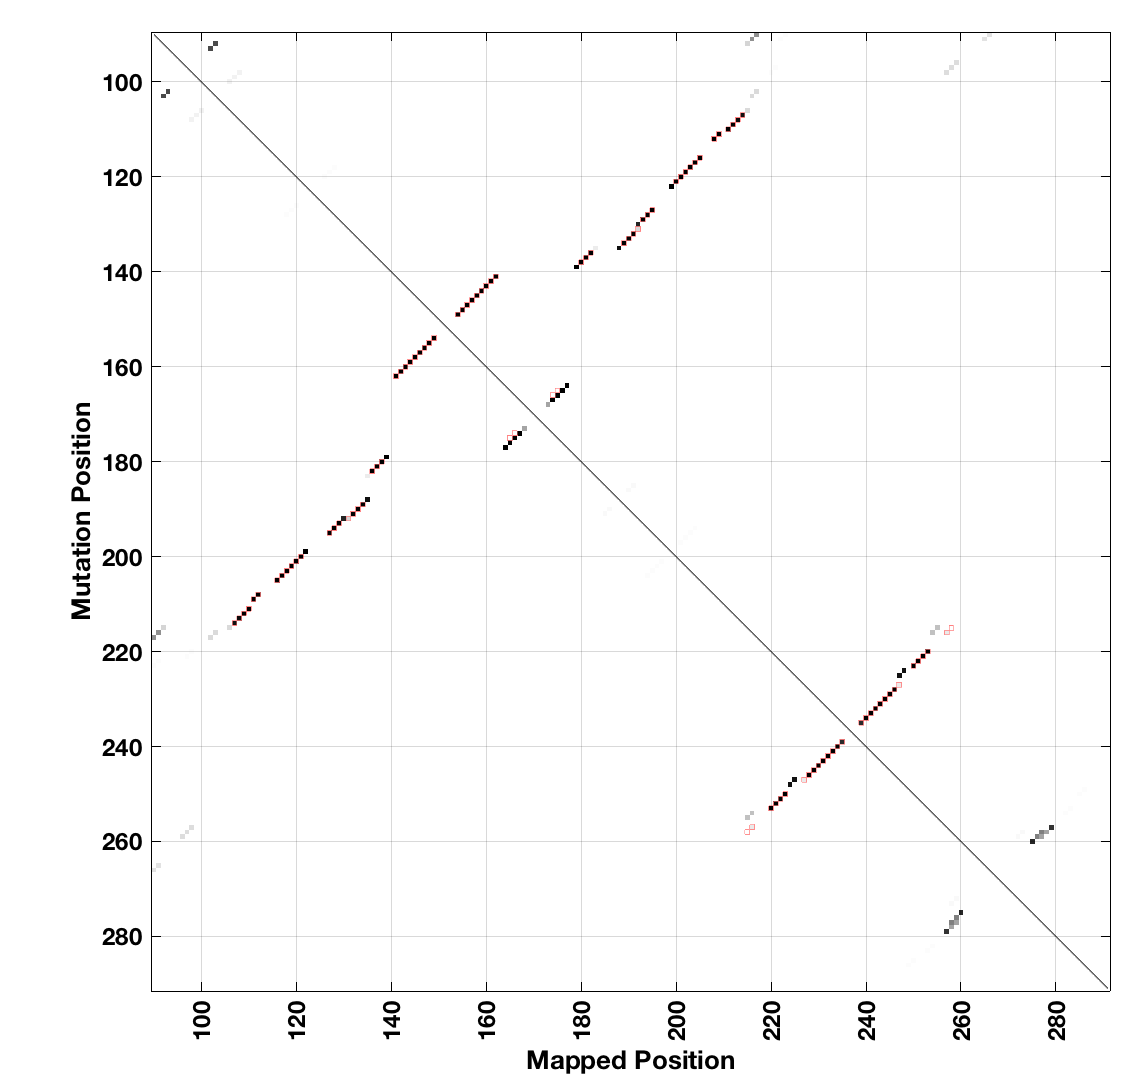
You can visualize results as a 2D matrix of bootstrap probabilities compared to reference structure like this:
clf;
show_2dmap( bpp, r_m2seq_DMS.structure, r_m2seq_DMS.offset, 1 );
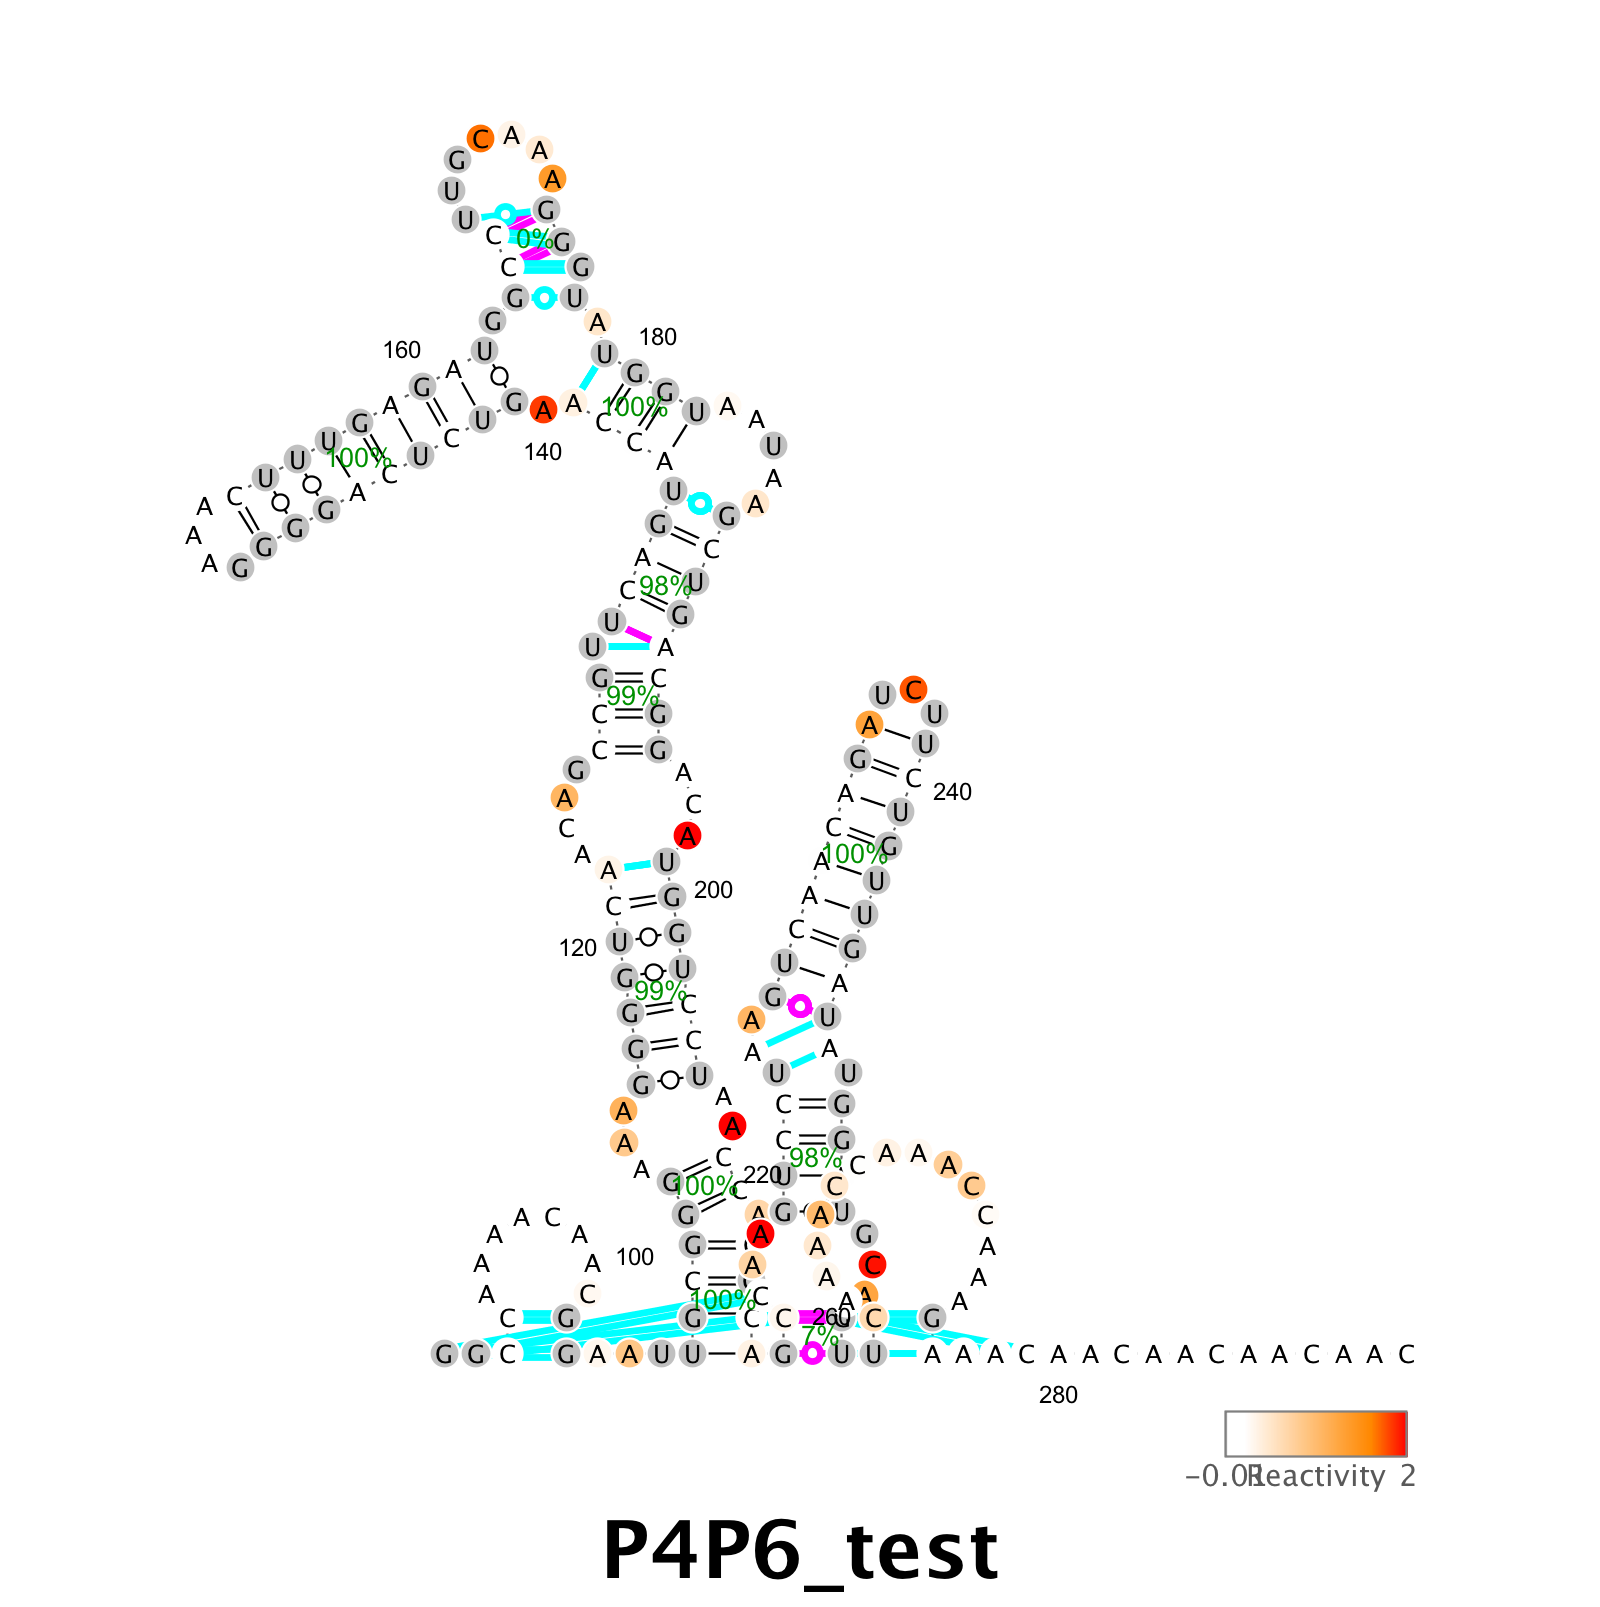
Or with bootstrap uncertainties overlaid on the structure figure like this:
output_varna( 'P4P6_test.png', r_m2seq_DMS.sequence, r_m2seq_DMS.structure, r_m2seq_DMS.structure, structure_m2seq,r_m2seq_DMS.offset,[],[],d_DMS,bpp );
What if I don’t have no-mod? What if the RNA is thought to have pseudoknots?
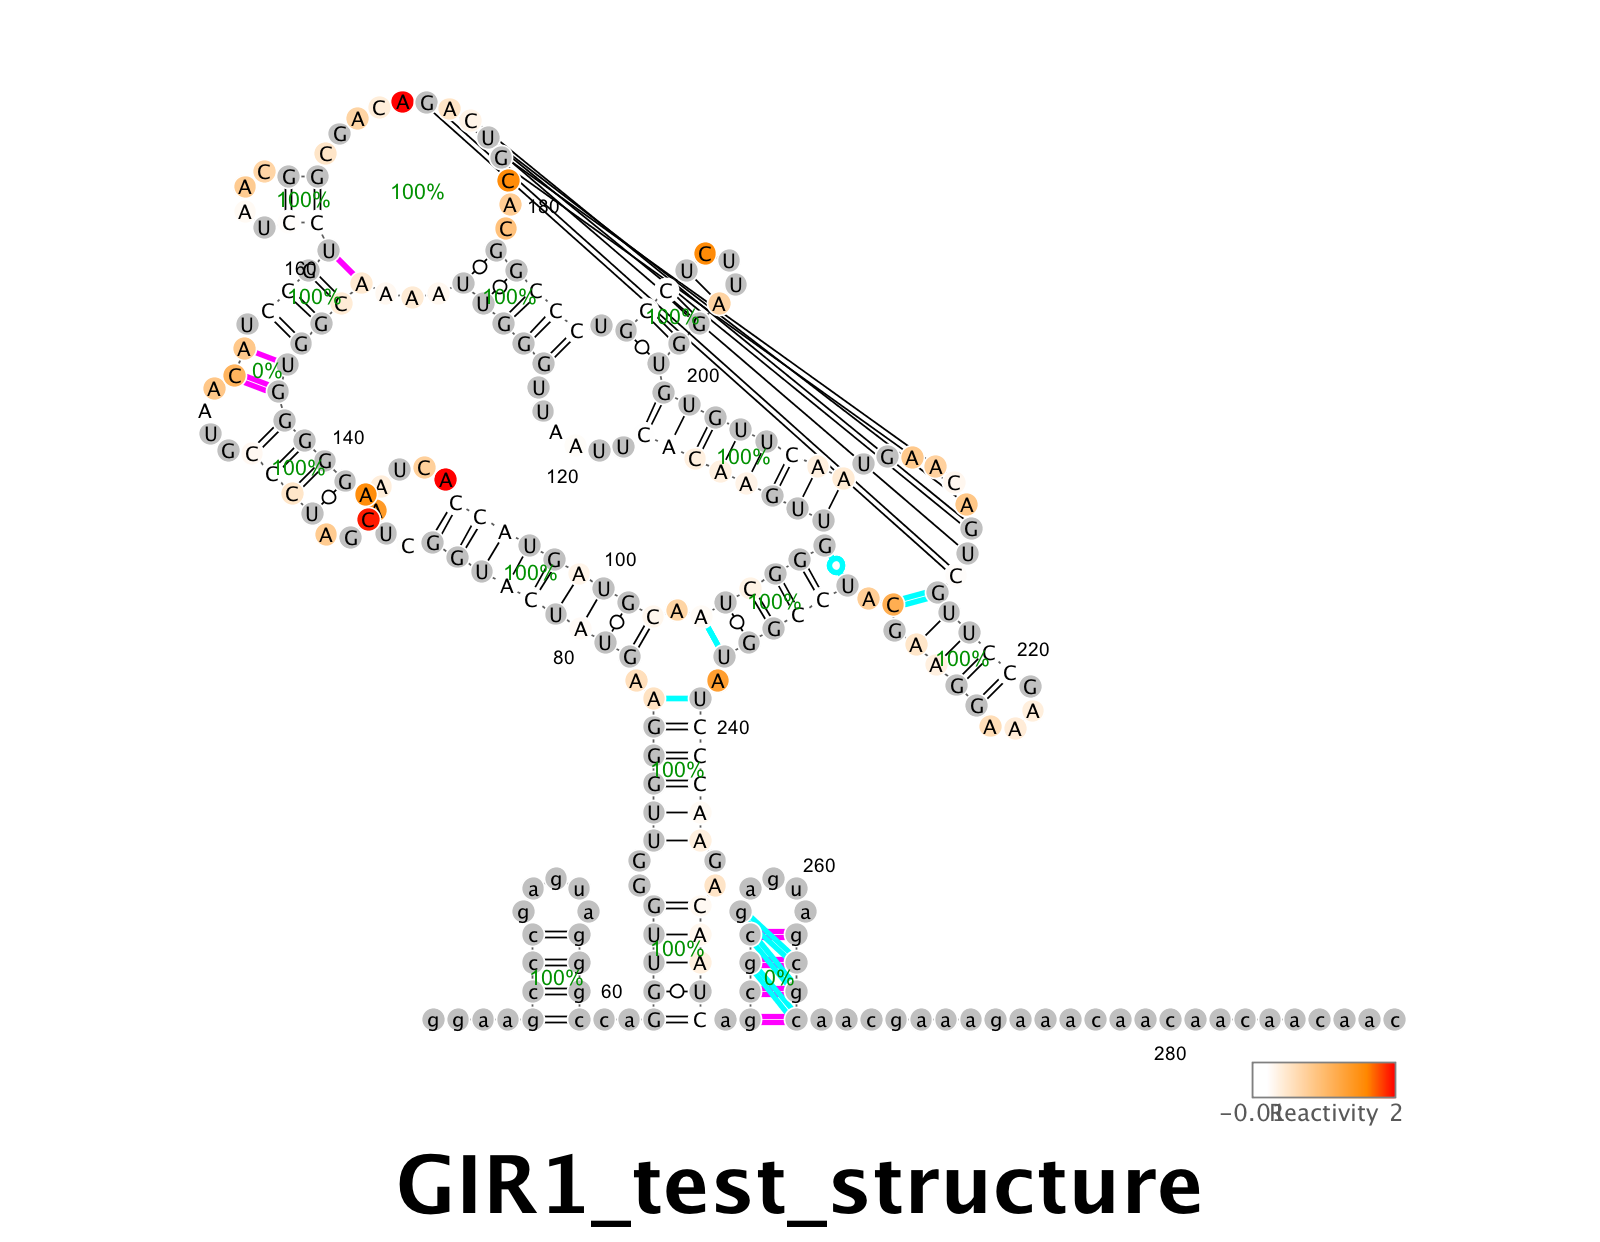
Don’t worry, for the above analysis the no-mod data are not super important, and you can model pseudoknots. Here are example instructions with DMS M2-seq data from the GIR1 lariat-capping ribozyme, downloaded from GIR1RZ_DMS_0001.rdat.
r_m2seq_GIR1   = read_rdat_file( 'GIR1RZ_DMS_0001.rdat' );

% Run M2-net
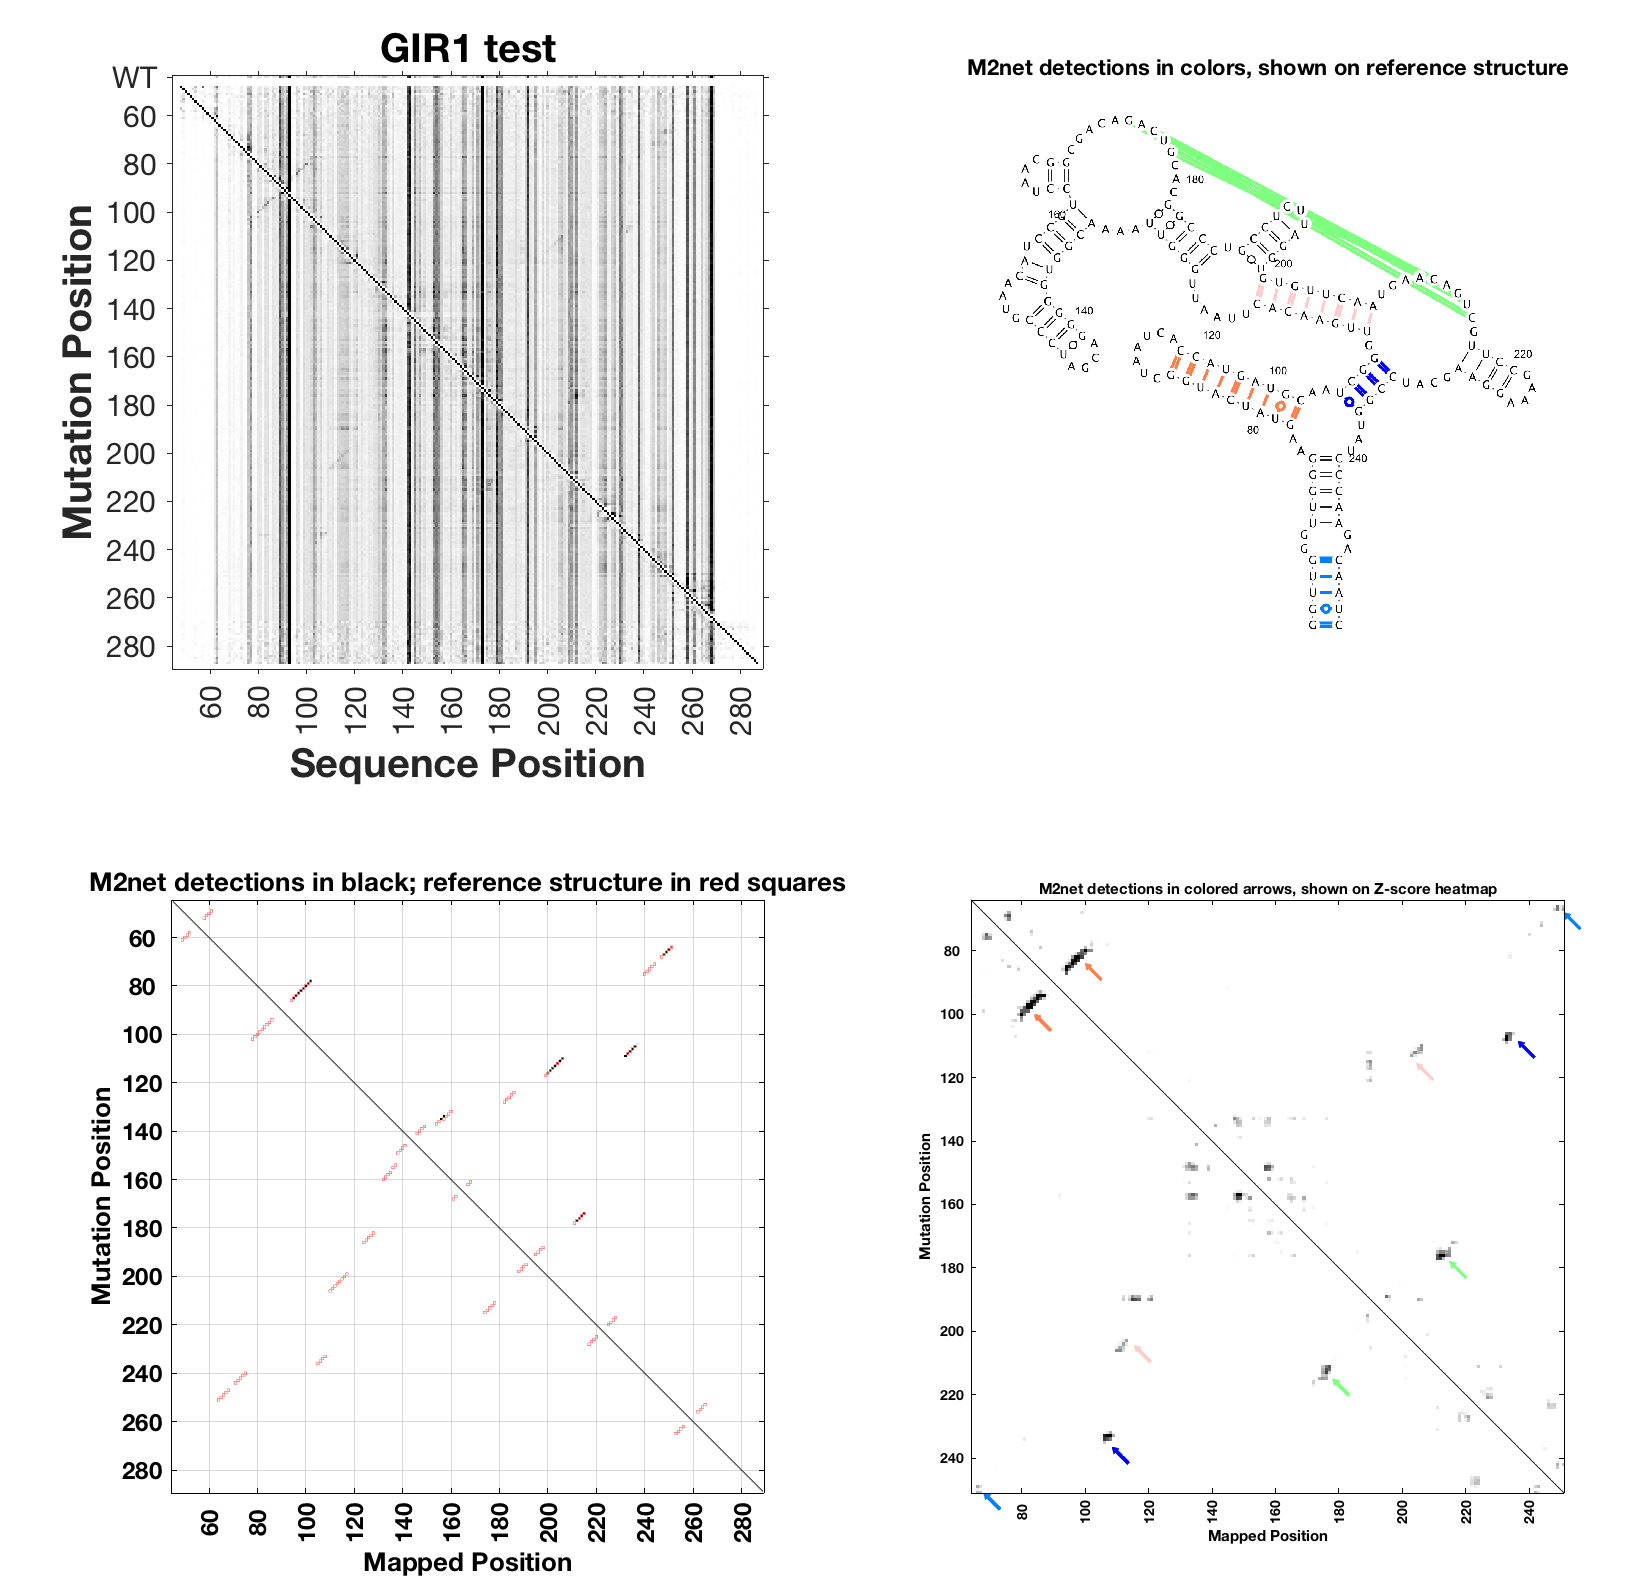
m2seq_summary( r_m2seq_GIR1, 'GIR1 test' );

% Get 1D and 2D data
% get_DMS_profile will look at U,G to estimate background at A, C:
d_GIR1_DMS = SHAPE_normalize( get_DMS_profile( r_m2seq_GIR1 ) );

% Z-score actually doesn't use no-mod data except to filter out rare artifact hits -- just give blank.
Z = output_Zscore_from_rdat( [], r_m2seq_GIR1, [], [], 1, 1 );

% Run RNAstructure with SHAPEknots. No bootstrapping to save time.
[structure_m2seq_GIR1,bpp_GIR1_DMS] = rna_structure( r_m2seq_GIR1.sequence, [], r_m2seq_GIR1.offset, r_m2seq_GIR1.seqpos, Z, 0, 1, d_GIR1_DMS );

clf;
output_varna( 'GIR1_test_structure.png', r_m2seq_GIR1.sequence, r_m2seq_GIR1.structure, r_m2seq_GIR1.structure, structure_m2seq_GIR1,r_m2seq_GIR1.offset,[],[], d_GIR1_DMS,bpp_GIR1_DMS);
Example output from RNAstructure/VARNA:
- Previous: HiTRACE analysis
- Previous: Biers dependencies
- Next: Visualize secondary structure
