Color 3D Model
Now that you have quantified chemical mapping data, you may find it helpful to visualize your reactivities on 3D models of your RNA of interest. This page lays out the steps for coloring a 3D model of an RNA in PyMOL with quantified reactivities obtained from chemical mapping or hydroxyl radical footprinting experiments.
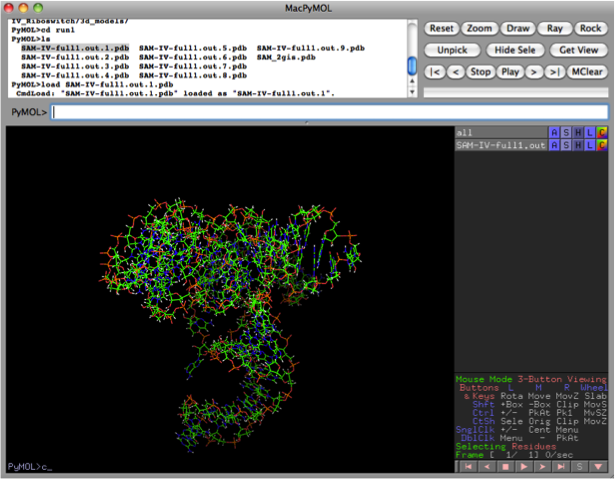
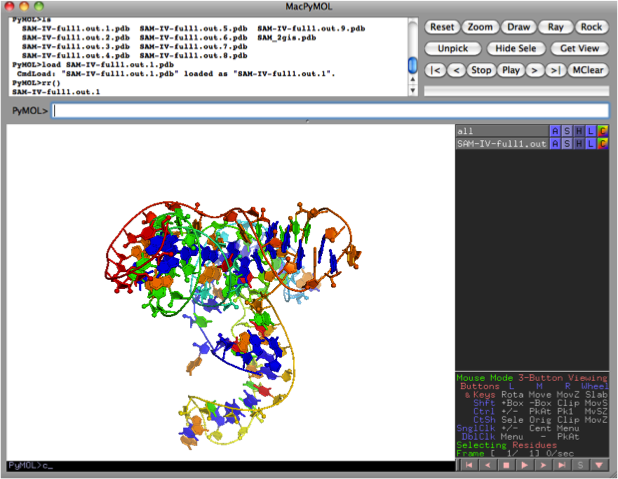
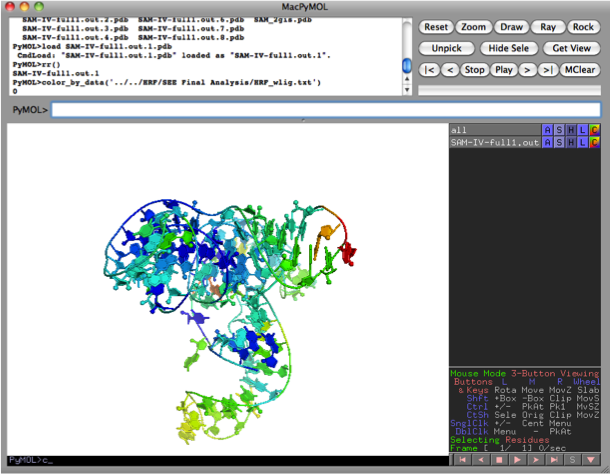
A brief walkthrough is included at the end for coloring a single model of a SAM-I/IV riboswitch with hydroxyl radical footprinting reactivities in the presence of 10mM SAM ligand.
Preparations
-
An RNA model of interest in PDB format
-
Quantified reactivity data in a MATLAB variable
-
Have HiTRCE and
RiboVisinstalled (see here) - (Optional) loadDir.pml, a useful command for coloring a set of .pdb files at once
Create text files for reactivity
First, we will convert the quantified reactivity data in your MATLAB variable into a set of text files with two columns separated by spaces. The first column will contain the residue number, while the second column will contain the reactivity measurement at that residue.
Use the script data_for_3d_color() in MATLAB (from HiTRACE) to convert a data array to text files that will be read by the color_by_data() function in PyMOL. The user must initially input the data array, as well as the range of measurements in the array that correspond to the sequence in the PDB file, excluding any 5′ and 3′ flanking sequences.
When run, data_for_3d_color() prompts the user for the names of the conditions corresponding to each column (= lane) of data and creates the folder 'Data for 3d color' containing text files named after the user-defined inputs.
Example:
>> data_for_3d_color(data, [24:96]);
Condition: DMS
Condition: SHAPE
>>
The folder ‘Data for 3d color’ will be created containing ‘DMS.txt’ and ‘SHAPE.txt’.
Color 3D models by reactivity
Now that you have .txt files with reactivities and sequence positions, it’s time to color some 3D models!
- Open PyMOL and run:
run ribovis.py
Or have it setup automatically (see here).
- Load PDB of interest:
load filename.pdb
If you would like to read in a whole directory of .pdb files at once, you may run loadDir.pml, which defines the command
loadDir(). Example:
loadDir dir, *.pdb
reset
It load all .pdb files in directory dir and resets view of molecule. You can add multiple sets of .pdb’s by changing the directory name and rerunning the command.
- (Optional) Set Options:
Then, if desired, set the background color and other visualization options (filled rings, cartoon backbone, etc.). Commands in RiboVis provide preset visualization schemes (detailed here):
rr()
- Color the structure by data
color_by_data('filename.txt')
If the coloring scheme is improperly scaled (e.g. structure is all red or all blue), you can set minimum and maximum reactivity values to fix scaling:
color_by_data('filename.txt', 0, 0, 1)
Last, make sure to save your PyMOL session as a .pse file!


