Step 10: Calculate Z-score (for 2D data only)
This step requires proper setup of the package rdatkit. Please follow the installation guides there. Note that we only using the MATLAB components of rdatkit.
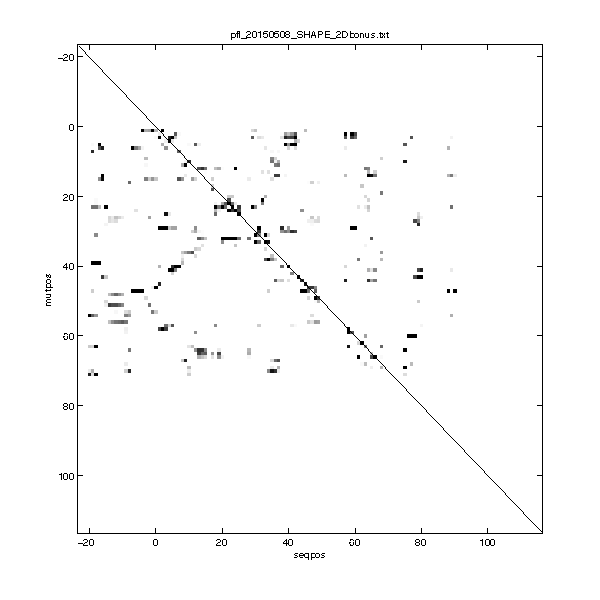
For Mutate-and-Map data, we care the most about ‘release’ events, i.e. a nucleotide becomes more reactive upon mutagenesis. Thus, the Z-score is a great extraction of the traces. It compare a nucleotide’s reactivity across all mutants, and score each one with how many standard deviation it ‘stands out’ from the mean.
Nucleotide position that is originally reactive above certain cutoff is ignored, since we can’t tell the ‘release’ for something already reactive.
Final Z-score are multiplied by -1.0 for the use as pseudo-free energies.
For more information, see these papers:
Tian, S., Cordero, P., Kladwang, W., and Das, R. (2014)
High-throughput mutate-map-rescue evaluates SHAPE-directed RNA structure and uncovers excited states
RNA 20 (11): 1815 - 1826.
Kladwang, W., VanLang, C.C., Cordero P., and Das, R. (2011)
A two-dimensional mutate-and-map strategy for non-coding RNA structure
Nature Chemistry 3: 954 - 962.
To calculate Z-score, we use this command that reads in the RDAT file:
Z = output_Zscore_from_rdat('pfl_SHAPE_2Dbonus.txt', {filename});
It also saves the Z-score matrix into a text file with the name you give. The reason that the data does not fill the entire figure (square) is that we only mutated along the region of interest, while the sequence contains flanking sequences. (So it’s a rectangle window!)
If the
'mutation'tag indata_annotationsin you RDAT file contains T instead of U (e.g. A55T instead of A55U), theoutput_Zscore_from_rdat()can’t function properly. Fix your RDAT file.
